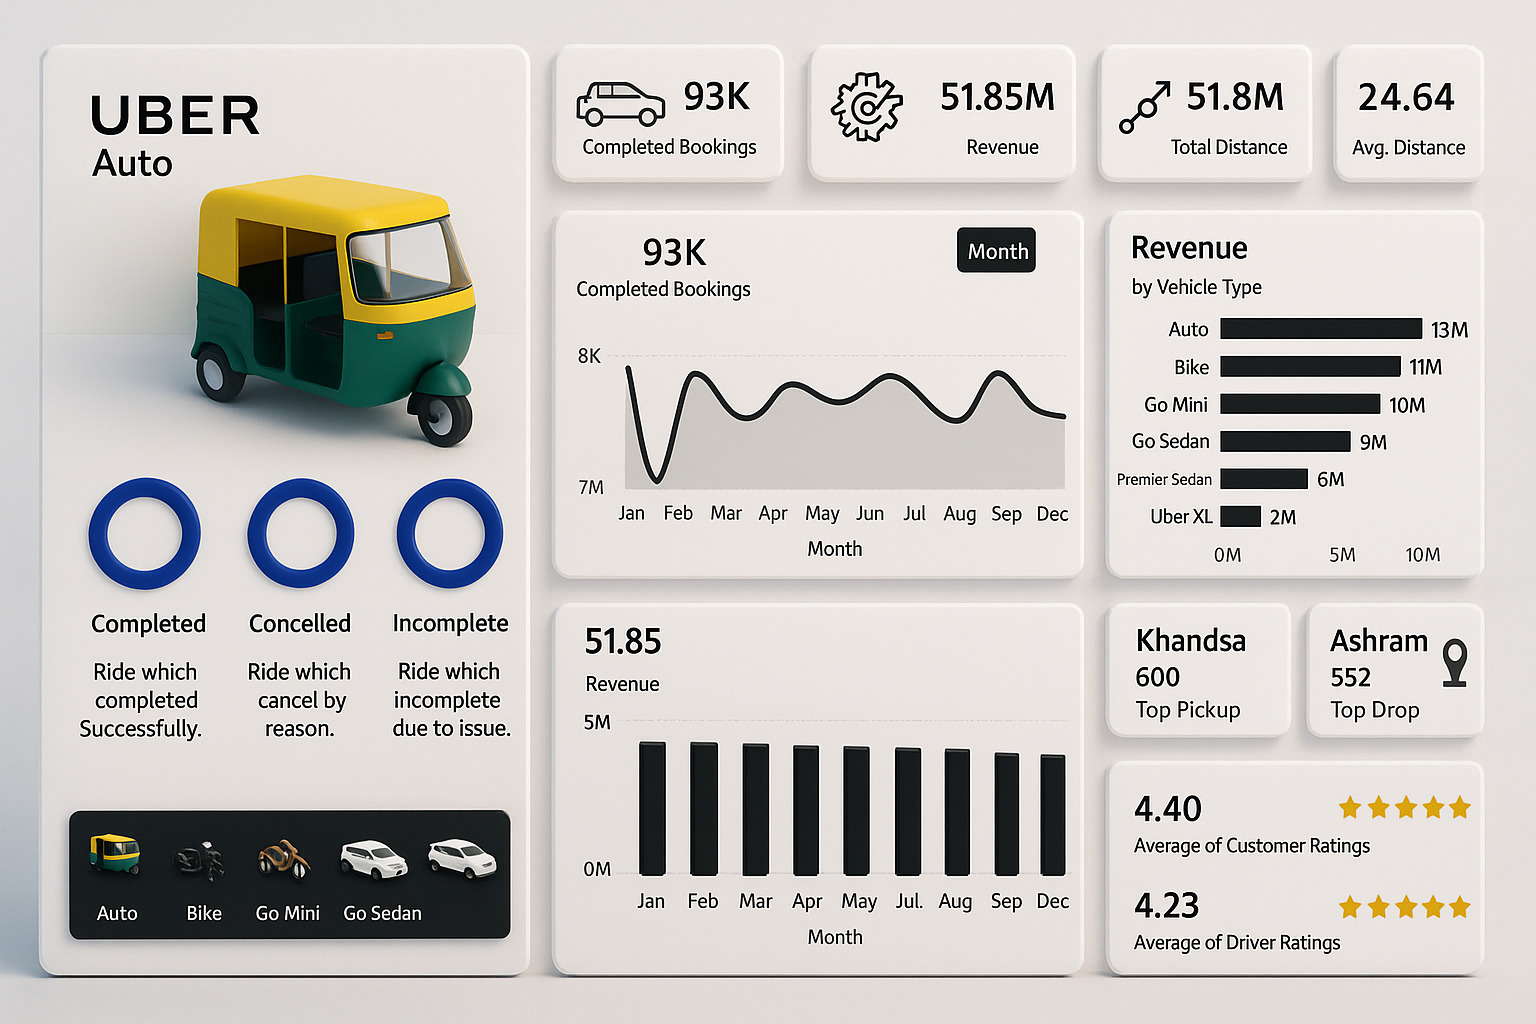
Uber Analysis Dashboard
An interactive dashboard analyzing Uber ride data, focusing on key metrics, ride trends, and revenue insights.
.jpg)
I design fast, focused dashboards and intelligent data products using **Power BI, Python, SQL, R, DAX** and **FastAPI**. Results that speak in charts, not noise.
Holding a Master's in Advanced Computer Science with Data Science from the University of Strathclyde, Glasgow, I specialize in transforming raw data into actionable business intelligence. My passion lies in bridging the gap between complex datasets and strategic decision-making through clear visualizations and predictive modeling. I particularly enjoy applying AI and machine learning techniques to uncover deeper patterns and enhance analytical capabilities.
My goal is to help organizations leverage their data effectively, driving measurable results and fostering growth through insightful analytics.
An interactive dashboard analyzing Uber ride data, focusing on key metrics, ride trends, and revenue insights.

Human AI system with eye tracking and knowledge graphs to deliver semantic writing support in real time. Built with React and FastAPI.
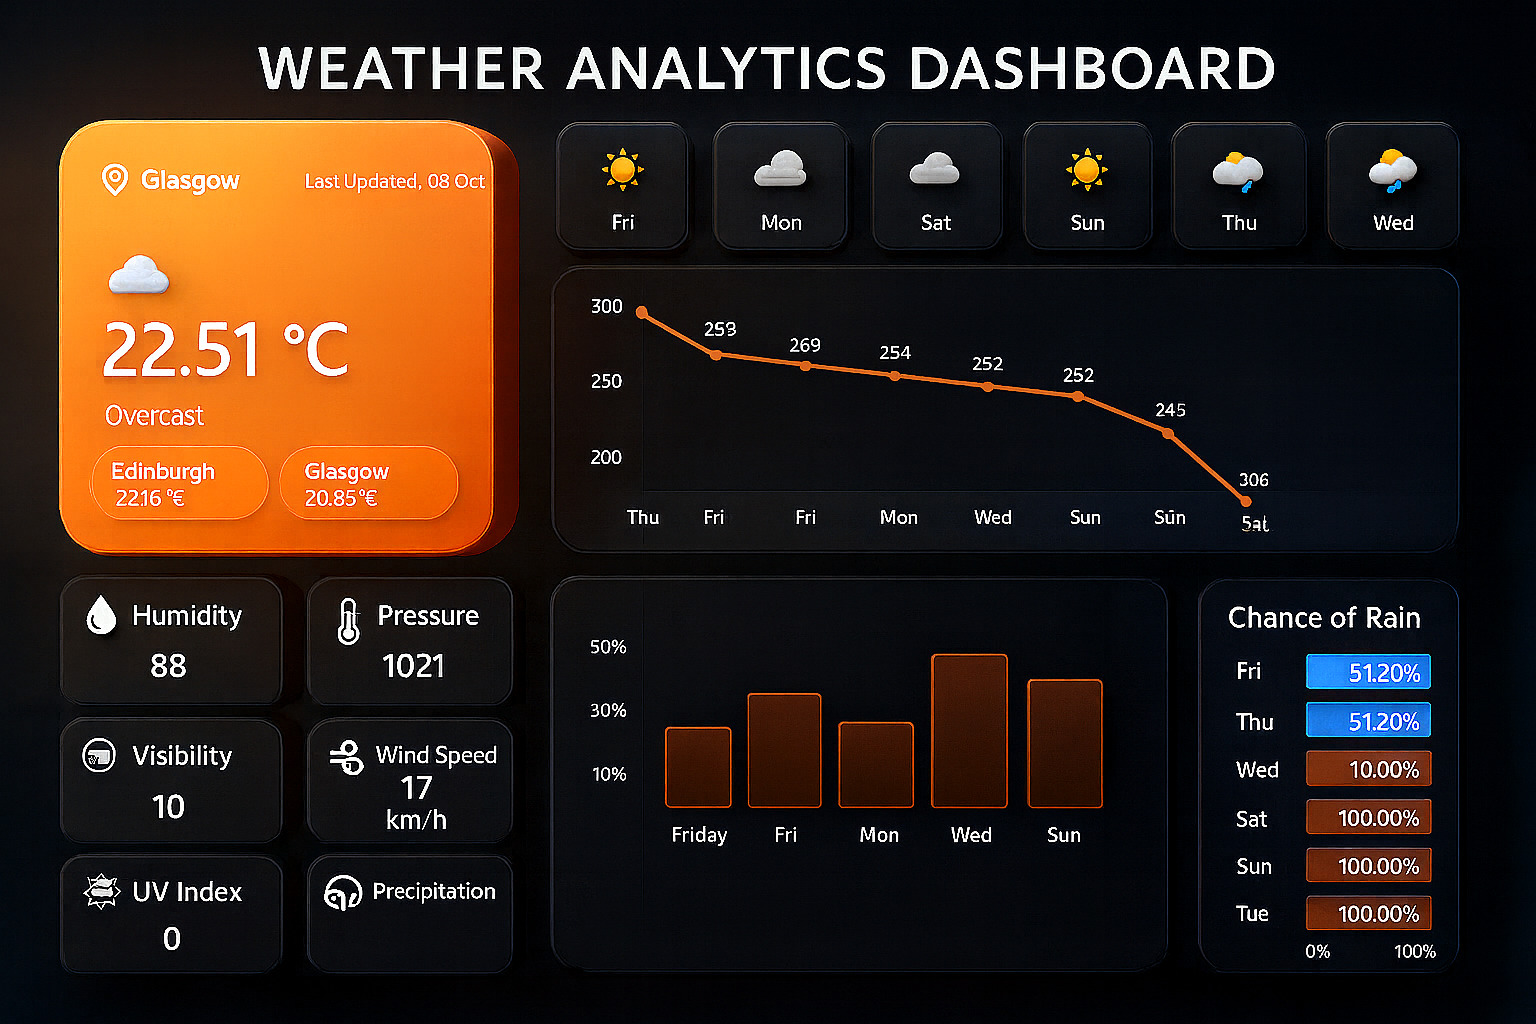
Power BI dashboard using WeatherAPI data: temperature, humidity, UV, precipitation, wind and DAX driven trends.
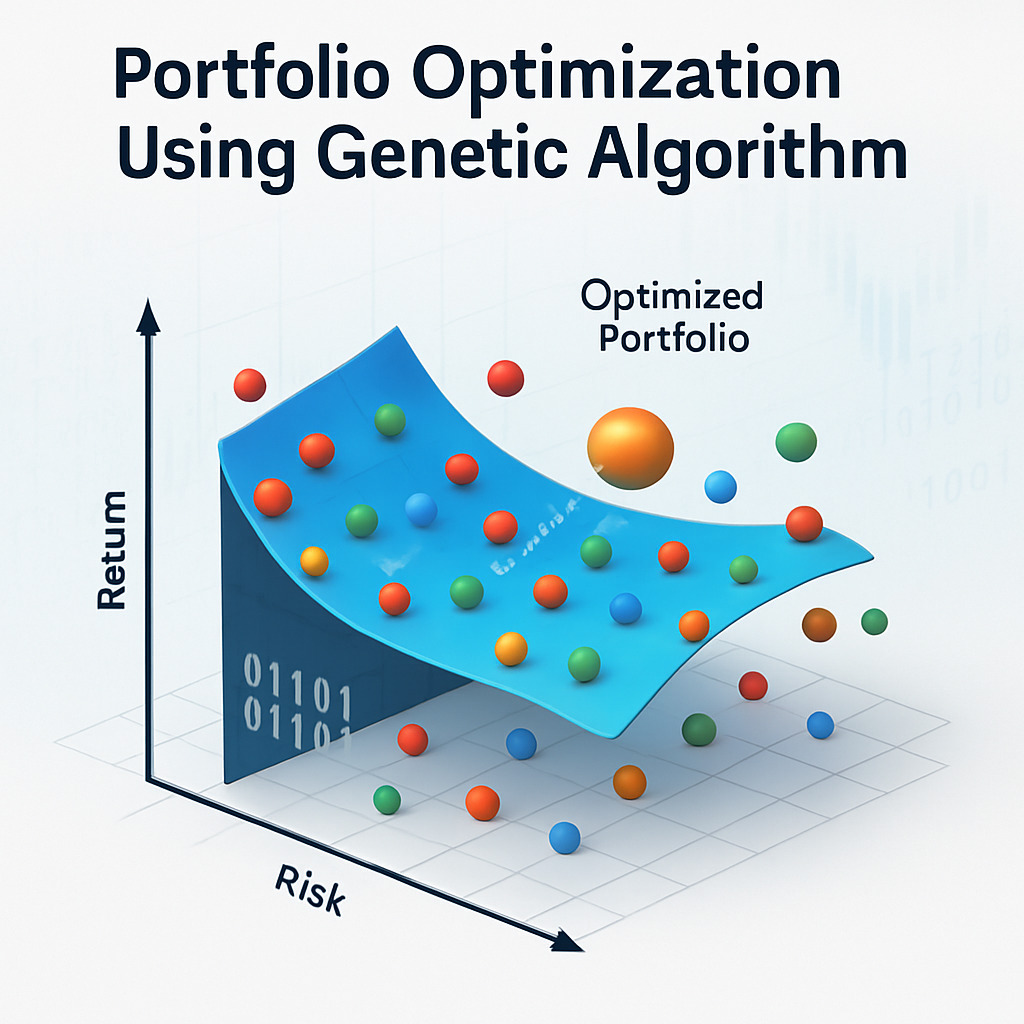
Genetic Algorithms in R to optimize asset weights and improve risk return trade offs. Benchmarked against random and equal weight portfolios.
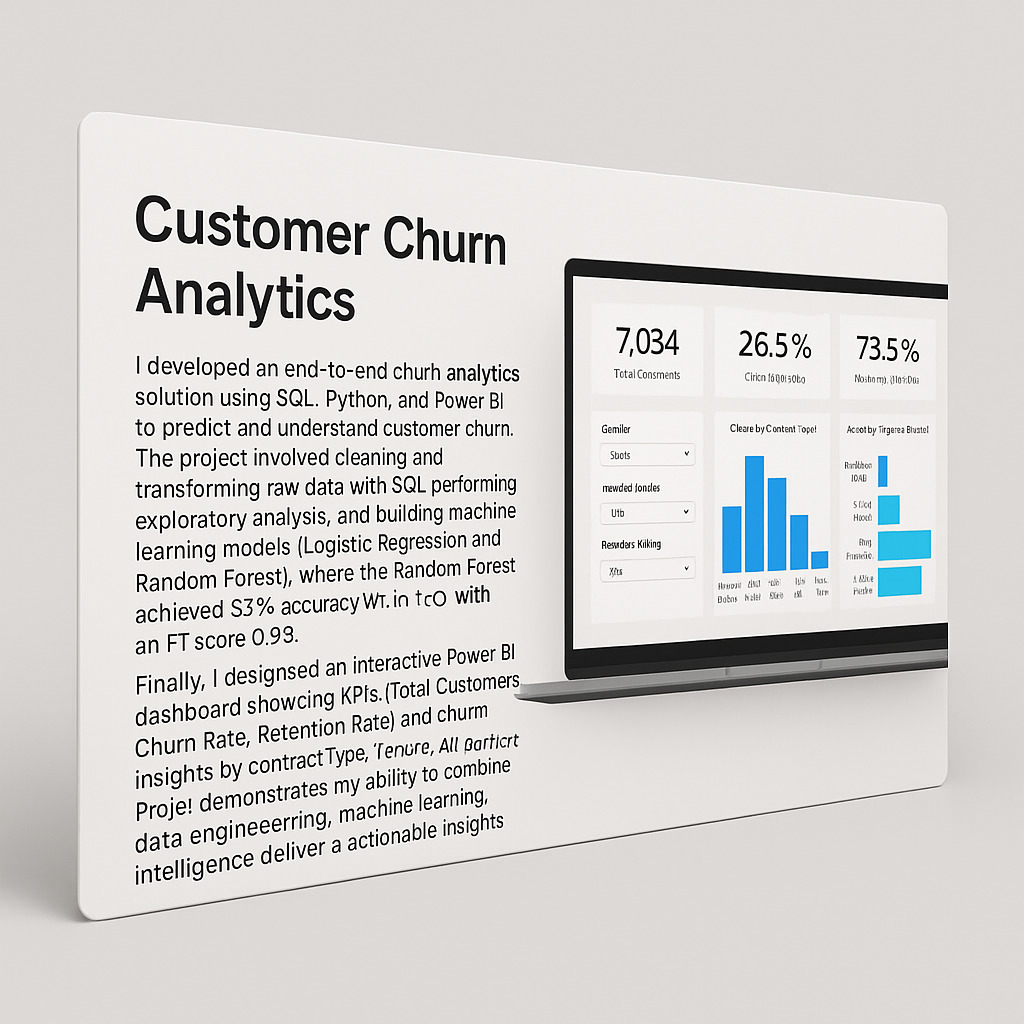
End to end churn prediction with SQL, Python and Power BI. Interactive KPIs highlight retention levers and risk segments.